|
Table 2. Diversity of mtDNA haplotypes and frequencies of race-specific mtDNA haplogroups
in the gene pools of Turkic ethnic groups and North-East Asian indigenous populations
Fedorova et al., 2003
| Population |
Total HVSI
haplotypes |
H |
Gene pool component, % |
Notes |
|
Caucasian |
Mongoloid |
Unidentified |
| Türkic ethnic groups |
| Chuvash |
39 | 0.988 |
89.1 |
9.1 |
1.8 |
| Tatars |
91 |
0.976 |
89.1 |
10.3 |
0.6 |
| Turks (added) |
|
|
66.9 |
6.0 |
10.6 |
| Bashkirs |
105 |
0.988 |
60.7 |
39.3 |
0 |
| Kazakhs |
45 |
0.990 |
40.0 |
56.4 |
3.6 |
| Shorians |
nd |
nd | 35.7 |
64.3 |
0 |
| Uigurs |
46 |
0.993 |
34.5 |
54.5 |
10.9 |
Alt. data |
| Kyrgyz |
70 |
0.990 |
27.4 |
68.4 |
4.2 |
| Altaians (N = 110) |
|
|
27.27 |
|
13.64 |
| Altai-kizhi |
nd |
nd | 23.9 |
67.4 |
8.7 |
| Tofalars (N = 58) |
|
|
20.69 |
|
3.44 |
| Khakassians |
nd |
nd | 18.5 |
75.9 |
5.6 |
| Sakha (Yakuts) |
67 |
0.964 |
8.4 |
91.6 |
0 |
| Todjins (N = 48) |
|
|
8.33 |
|
6.25 |
| Soyots |
nd |
nd |
5.9 |
88.2 |
5.9 |
| Tuvinians |
nd |
nd | 5.6 |
94.4 |
0 |
| Uzbeks (added) |
|
|
|
|
|
| North-East Asian populations |
| Evens |
33 | 0.962 |
0 | 90.8 |
9.2 |
| Koryaks |
41 | 0.945 |
0 | 100 |
0 |
| Itelmen |
19 | 0.931 |
0 | 100 |
0 |
| Chukcha |
19 | 0.883 |
0 | 100 |
0 |
| Eskimo |
12 | 0.819 |
0 | 100 |
0 |
| Nenets |
|
|
|
|
|
| Mongolia |
| Mongols |
83 | 0.990 |
13.6 |
86.4 |
0 |
| Note: The number of HVSI haplotypes has not been determined (nd) in some cases,
as mtDNA haplogroups have been established by
R
FLP analysis without HVSI sequencing
|
|
|
H, HV1, J, T, U, W - Western Eurasian (aka
Caucasian) mtDNA haplogroupsHaplogroup:
H
HV1
J
T
U
W
O* is ancestral to about a half of Europeans
|
A, B, C, D, F, G, M*, Y - Eastern Eurasian (aka Asian, Mongoloid) mtDNA
haplotypes
Haplogroup:
A is common for virtually all Siberian ethnic groups
B originates from South Asia
C is a source of female mt-DNA among
the Türkic people. Into the Türkic fold it comes from the Tungus (Ch. Dunhu) peoples, who are
known to us as Tunguses and Mongols and Manchu, and also as Koreans and Japanese. The highest diversity of
C is in the Indian subcontinent (50,000 bp), indicating location of its emergence. C spread to many indigenous populations of Siberia and in Central Asian ethnic groups,
reaching Goths, modern England and New York, provinces of Belgium, and Amerindians prior to 1492.
D is a source of female mt-DNA among
the Türkic people. Into the Türkic fold it comes from the Tungus (Ch. Dunhu) Mongols and Manchu, and also
from north-eastern Asian people.. The highest diversity of D is in the Middle Asia (40,000 bp), indicating location of its emergence.
D spread to and with many indigenous populations of Siberia,
reaching Goths, modern England and New York, provinces of Belgium, and Amerindians prior to 1492.
F originates from South Asia similar in distribution to haplogroup B
Haplogroup G contains two subclusters:
Gl characteristic of North-East Siberian populations
G2a with highest (8.8%) frequency detected in Central Asia
Y is thought to originate from the Far East
M* is thought to arose 50,000-70,000 BP in Southern Asia and
migrated to Southeastern Asia 50,000-60,000 BP.
M1 is much older than notable expansion time of 12,000-13,000 BP
Y is
N is popular in Africa. Analysis of Aurignacian
Cro-Magnon mtDNA attests that their mamas belonged to haplogroup N. |
Table 3. mtDNA Haplogroup frequency distribution in the gene pools of Türkic
ethnic groups
and North-East Asian indigenous populations
Fedorova et al., 2003
| Population |
mtDNA Haplogroup frequency, % |
| Eastern Eurasian Haplogroups |
Western Eurasian Haplogroups |
Others |
| Graph |
|
В |
С |
D |
G |
F | >
M* |
J |
Т |
U |
H |
| Türkic ethnic groups |
| Chuvash |
 |
1.8 |
0 |
1.8 |
3.6 |
0 |
0 |
1.8 |
5.5 |
3.7 |
36.4 |
25.5 |
19.9 |
| Tatars |
 |
2.3 |
0 |
1.7 |
2.9 |
1.2 |
0 |
2.3 |
8.1 |
8.1 |
24.7 |
31.6 |
17.1 |
| Bashkirs |
 |
4.3 |
0 |
12.8 |
8.1 |
4.7 |
6.2 |
1.0 |
3.3 |
5.2 |
27.5 |
14.2 |
12.7 |
| Kazakhs |
 |
9.6 |
5.8 |
7.7 |
19.2 |
5.8 |
1.9 |
5.8 |
0 |
7.7 |
5.7 |
15.4 |
15.4 |
| Shorians |
 |
0 |
2.4 |
7.1 |
9.5 |
0 |
43.0 |
2.4 |
11.9 |
0 |
0 |
21.4 |
2.3 |
| Uigurs |
 |
7.3 |
7.3 |
1.8 |
16.4 |
0 |
7.3 |
7.3 |
0 |
1.8 |
16.4 |
20.0 |
14.4 |
| Kyrgyz |
 |
3.3 |
6.5 |
14.1 |
19.6 |
7.6 |
3.3 |
6.5 |
5.4 |
3.3 |
3.3 |
18.5 |
8.6 |
| Altaians (N = 110) |
 |
0 |
3.64 |
19.09 |
15.45 |
0.91 |
8.18 |
11.82 |
3.64 |
0.91 |
16.36 |
6.36 |
13.64 |
| Altai-kiji |
 |
3.3 |
3.3 |
30.4 |
9.8 |
4.4 |
5.4 |
9.8 |
5.4 |
0 |
5.4 |
5.4 |
17.4 |
| Tofalars (N = 58) |
 |
5.17 |
3.45 |
62.08 |
0 |
0 |
0 |
5.17 |
8.62 |
5.17 |
0 |
6.9 |
3.44 |
| Khakassians |
 |
3.7 |
5.6 |
35.2 |
9.3 |
0 |
22.0 |
0 |
1.9 |
1.9 |
11.1 |
3.7 |
5.6 |
| Sakha (Yakuts) |
 |
2.1 |
0.5 |
44.0 |
30.4 |
4.2 |
6.3 |
2.6 |
1.1 |
1.1 |
1.1 |
2.6 |
4.0 |
| Todjins (N = 48) |
 |
4.17 |
4.17 |
47.91 |
4.17 |
18.75 |
2.08 |
4.17 |
0 |
0 |
6.25 |
2.08 |
6.25 |
| Soyots |
 |
8.8 |
2.9 |
17.6 |
50.0 |
0 |
0 |
0 |
0 |
0 |
5.9 |
0 |
14.8 |
| Tuvinians (n=36) |
 |
5.6 |
14.0 |
36.1 |
16.7 |
5.6 |
8.3 |
0 |
0 |
0 |
2.8 |
2.8 |
8.1 |
| Tuvinians (n=458) |
 |
3.1 |
3.7 |
48.9 |
9.9 |
nd |
nd |
nd |
nd |
nd |
nd |
nd |
nd |
| Uzbeks (added) |
 |
|
|
|
|
|
|
|
|
|
|
|
|
| Turks (added) |
 |
1.3 |
0 |
|
|
|
0.3 |
4.4 |
10.9 |
11.9 |
19.1 |
25 |
10.6 |
|
North-West Asian populations (Uralic/Ugro-Finn ethnic groups) |
| Komi-Permyaks |
 |
|
|
|
|
|
|
|
|
|
|
|
|
| Komi-Zyryans |
 |
|
|
|
|
|
|
|
|
|
|
|
|
| Mari |
 |
|
|
|
|
|
|
|
|
|
|
|
|
| Mordvins |
 |
|
|
|
|
|
|
|
|
|
|
|
|
| Udmurts |
 |
|
|
|
|
|
|
|
|
|
|
|
|
|
North-West Asian populations (Uralic/Nenets ethnic group) |
Ic R1bd R1a N3 N2 Q C
0 0 0 40.5 56.8 1.4 0 |
| Nenets |
| nd |
nd |
0 |
nd |
nd |
nd |
nd |
nd |
nd |
nd |
nd |
nd |
North-East Asian populations
Chukotko-Kamchatkan language family Chukcha,
Eskimo |
| Koryaks |
 |
5.2 |
0 |
36.1 |
1.3 |
41.9 |
0 |
0 |
0 |
0 |
0 |
0 |
15.5 |
| Itelmen |
 |
6.4 |
0 |
14.9 |
0 |
68.1 |
0 |
0 |
0 |
0 |
0 |
0 |
10.6 |
| Chukcha |
 |
68.2 |
0 |
10.6 |
12.1 |
9.1 |
0 |
0 |
0 |
0 |
0 |
0 |
0 |
| Eskimo |
 |
7.2 |
0 |
2.5 |
20.3 |
0 |
0 |
0 |
0 |
0 |
0 |
0 |
0 |
| Tungus (Ch. Dunhu), Manju, Koreans, Japanese |
| Evenks |
 |
3.9 |
0 |
84.3 |
9.8 |
0 |
2.0 |
0 |
0 |
0 |
0 |
0 |
0 |
| Evens |
 |
4.6 |
0 |
26.2 |
15.4 |
0 |
0 |
1.5 |
0 |
0 |
0 |
0 |
52.3 |
| Mongolia (Mongols) |
| Buryats |
 |
|
|
|
|
|
|
|
|
|
|
|
|
| Mongols |
 |
3.9 |
9.7 |
14.6 |
30.1 |
2.9 |
5.8 |
11.7 |
| 1.0 |
3.9 |
7.8 |
8.6 |
| Note: Cases when a haplogroup has not been determined (nd) are
indicated |
Table 25.1. MtDNA haplogroups in Anatolian-Trans-Caucasus populations (%)
Kristiina Tambets et al., 2000
| Population |
Eastern Eurasian Haplogroups |
Western Eurasian Haplogroups |
|
|
|
|
|
|
|
|
|
|
|
|
|
A |
Ä |
B |
F |
M |
Ml |
J |
T |
U |
H |
I |
K |
L |
O |
O* |
P* |
V+pV |
R* |
pJT/pHV |
W |
X |
Ü |
| Armenians |
0 |
2.6 |
0.5 |
0 |
0 |
0 |
8.9 |
11.5 |
20.4 |
30.9 |
1.6 |
7.9 |
0.5 |
1 |
7.3 |
0 |
0 |
1 |
0.5 |
1 |
2.1 |
2.1 |
|
Georgians |
0 |
2.2 |
0 |
0 |
2.2 |
0.7 |
3.6 |
12.9 |
21.6 |
17.3 |
2.2 |
10.1 |
0 |
0 |
7.2 |
1.1 |
0.7 |
5 |
0.7 |
1.4 |
10.1 |
0 |
| Ossetes |
0 |
11.8 |
0 |
0 |
2.1 |
0 |
18.7 |
6.9 |
17.9 |
18.7 |
4.3 |
1.1 |
1.1 |
0 |
13.4 |
0 |
0 |
5.0 |
1.1 |
2.1 |
0.5 |
0 |
|
Turks |
0.5 |
0.8 |
0 |
0.3 |
4.1 |
0.3 |
10.9 |
11.9 |
19.1 |
25 |
2.3 |
5.9 |
0.3 |
1.3 |
3.6 |
0.5 |
0.3 |
1.7 |
2.3 |
3.9 |
4.4 |
0.3 |
|
| Y-DNA = papas |
Papas don't pass on mtDNA,
their mom's mtDNA dies with them, but to their male progeny they pass on their Y-DNA marker
practically intact. The end result is that other than maleness,
practically no genetic code from the male side is passed to the remote offsprings. Instead, they
pass on their dominant traditions and economy. Numerically, the female X-chromosome contains about
2000 genes, and the male Y-chromosome contains 78 genes, out of the minimum of 20,000 genes in the
human genome, a pitiful contribution.
But papas pass their Y-DNA marker intact, while mt-DNA is constantly changing from generation to
generation, which makes Y-DNA an indispensible holder of historical information. At the same time Y
chromosome is one of the fastest evolving parts of the human genome. Tracing Y-DNA marker and its
subtle changes allowed to build phylogenic trees and date them.
Unlike mtDNA, the Y-DNA does not correlate with geographical, linguistic, or phenotype domains.
The same Y-DNA may be found in the east and in the west, across numerous linguistic groups, among
Caucasoid, Negroid, and Mongoloid populace, while the mtDNA has expressed domains, and may be
attributed to the east and the west, has some linguistic correlation, and some phenotype
correlation. In the plot used in the “The King and I”, Margaret Landon eloquently expressed this
phenomena as “A man is like the honey bee, to fly from blossom to blossom, a honey bee must be
free, but blossom must not ever fly from bee to bee, to bee”. A bee is free to move from a rose
to a cherry tree, marking its trace with Y-DNA, but roses don't start producing cherries, it is the
domain of the egg and sperm nucleus. Offspring inherit one allele for each trait from each parent, thereby
ensuring that offspring have a combination of the parents' genes.
|
Папы не передают свою мтДНК, мтДНК их мам практически умирает с ними,
но своему мужскому потомству свой маркер Y-ДНК они передают
почти неизменным. В конечном счете с мужской стороны на практике отдаленому потомству не передается никакой генетический код кроме гена мужского пола. Вместо
генетического кода
они передают свои основные традиции и хозяйство. Численно, женская X-хромосома содержит около
2000 генов, а мужская Y-хромосома содержит 78 генов, жалкий вклад в геном человека состоящий из по
меньшей мере из 20 000 генов.
Папы передают свой Y-ДНК маркер нетронутым, а МТ-ДНК постоянно меняется от поколения до поколения, это делает
Y-ДНК единственным маркером исторической информации. Прослеживание Y-ДНК маркера и его незримых
изменений позволяет высчитывать и датировать
филогенетические древья.
В отличие от мтДНК, Y-ДНК не коррелирует с географическими, лингвистическими или фенотипными доменами.
Ту же Y-ДНК можно найти на востоке и на западе, у многочисленных языковых групп, среди кавказоидных, негроидных и монголоидных населений, в то время как мтДНК
имеет выраженные домены и может
быть связана с востоком и западом, иметь некоторую языковую корреляцию, и некоторую фенотипную корреляцию. В
сюжете использованном в“Король и я”, Маргарет Лэндон красноречиво выразила это явление как“Мужчина, как пчелка,
идет от цветка к цветку, пчелка должна быть свободной, но цветы никогда
не должны летать от пчелки до пчелки, до пчелки”. Пчела перемещается свободно от розы до черешни, отмечая свой след
маркером Y-ДНК, но розы не начинают приносить вишни, это задача ядeр яйцеклетки и спермы. Потомство
наследует один аллель каждого признака от каждого родителя, тем самым обеспечивая что потомство
имет сочетание генов родителей.
|
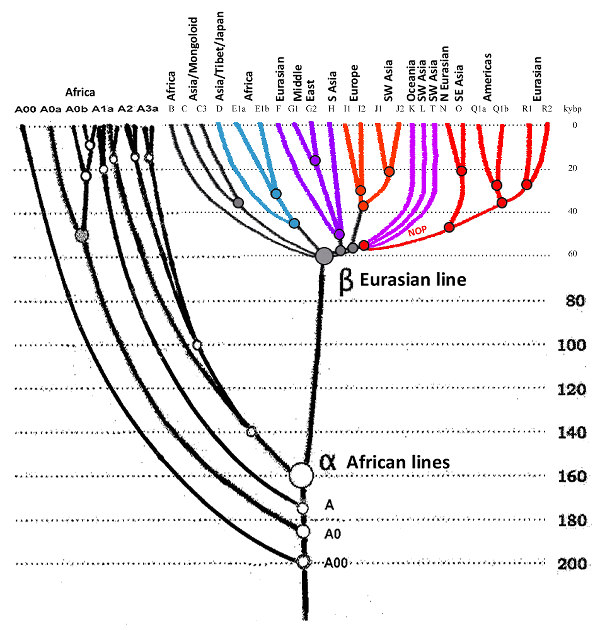
Dating and phylogeny for genetic Y-DNA marker of major groups in the text
(courtesy of A. Klyosov):
Датировка и филогения Y-ДНК генетических маркеров основных групп в тексте (любезность А. Клесова):
(Colors in the illustration do not correspond to the
J. D. McDonald 2005 table
Цвета иллюстрации не соответствуют таблице
J. D. McDonald 2005)
|
|
Y-DNA marker can be compared with golden dust from a creek that flows into a rivulet that merges
with the other rivers, and at the estuary divides into many branches. The dust settled on the bottom
does not reach the estuary of the present time, and the dust that came down to the estuary marks a
trace from the creek through the entire river system to the present day and our demographic reality.
The laminar areas of the system carry dust in parallel streams, stagnant areas are losing most of
markers, and turbulent regions stir everything that flows into them, diluting the relative
homogeneity of the laminar jet with additives from other laminar jets. Each sleeve of estuary
gathers a different set of markers from different sources.
The picture can be slightly clarified by changes in the structure of the dust particles. By
calculating their original form, it is possible to trace a pattern of their change in the stream in
time, and to determine the relative and absolute age. Tracking changes of the Y-DNA marker allows to
calculate and date a haplotype tree. This is Molecular History.
|
Y-ДНК маркер можно сравнить с золотистой пылью из источника, который вливается в речку, сливающуюся
с другими реками, и у устья разделяющйся на множество рукавов. Пыль, осевшая на дно, не доходит до
устья современности, а пыль, дошедшая до устья, отмечает трассу от источника через всю речную
систему до наших дней и нашей демографической реальности. Ламинарные участки системы несут пыль
параллельными потоками, застойные участки теряют большинство маркеров, а турбулентные участки
перемешивают все что в них вливается, разбавляя относительную однородность ламинарной струи
добавками из других ламинарных струй. В каждом рукаве устья собирается свой набор маркеров из различных источников.
Слегка прояснить картину помогают изменения в структуре самих пылинок.
Высчитав их первоначальную форму, возможно проследить закономерность в их изменении в потоке
времени, и определить относительный и абсолютный возраст. Прослеживание изменений Y-ДНК маркера позволяет высчитывать и датировать древья гаплотипов. Это-Молекулярная История. |
Haplotype tree haplogroup R1a1 in the Balkans
(courtesy of A. Klyosov):
Древо гаплотипов гаплогруппы R1a1 на Балканах (любезность А. Клесова):
(Modal (base) haplotype reached Balkans 9000 ybp
Модальный (базовый) гаплотип достиг Балкан 9000 лн)
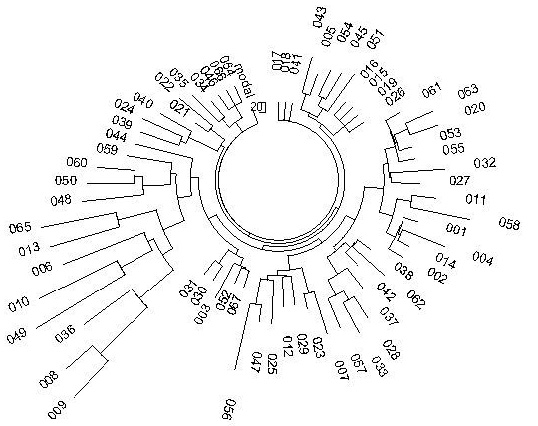 |
Being biological sequins, markers can multiply, and in favorable conditions replace other
markers, for example a feudal can fertilize all dames in his possession, producing male offspring of
others only with his marker. In a society with widespread landowning elite belonging to a dominant
ethnic group, Y-DNA markers of this group in a few generations would replace the markers of the more
numerous serfs, coming to the fore in the relative prevalence. In the parlance of the population
genetics, such genetical expansion is termed“meditated by males” |
Будучи биологическими блесточками, маркеры могут умножаться, и в благоприятных обстоятельствах заменять другие маркеры, как например владетель крепостных может оплодотворять всех дам в своем владении, производя чужих отпрысков мужского пола исключительно с его маркером. В обществе повсеместной принадлежностью землевладельческой элиты к доминантной этнической группе,
Y-ДНК маркеры этой группы за несколько поколений заменят маркеры более многочисленных крепостных, выйдя на
первый план по относительной распространенности. На жаргоне популяционной генетики, такое генетическое
распространение называется“посредством мужчин”. |
| |
http://hgm2001.hgu.mrc.ac.uk/Abstracts/Publish/WorkshopsPoster/WorkshopPoster06/hgm0198.htm
Y-chromosome haplotype diversity in populations of Altaic
language family
Vadim Stepanov, Valery Puzyrev, Maria Spiridonova, Vladimir Kharkov, Irina Khitrinskaya
Institute of Medical Genetics, Nab. Ushayky 10, Tomsk, 634050, Russia
(Note, all timing estimates in this assessment are arbitrary
guesstimates, and are systematically incorrect. For realistic data, turn to the works of A. Klyosov,
Klyosov A.
Türkic DNA genealogy,
Klyosov A.
R1b DNA History,
Klyosov A.
On IE R1a branch,
Klyosov A.
Autochthonous Altai DNA)
Distribution of Y-chromosome haplotypes in 10 ethnic groups of Siberia
and Middle Asia belonging to Altaic language family (Tuva, Buriat, Northern and Southern Altai, Evenk, Kirghiz, Uzbek, Siberian
Tatar, Uighur,Yakut) was investigated in order to reconstruct the evolution of paternal lineages in
North Eurasia.
In modern North Eurasian populations were found high level of gene diversity (H=1.00) and substantial degree of genetic differentiation of male-specific gene pool (Fst = 0.212). Most haplotypes in modern
Altaic population have common ancestry traced back to the Upper Paeleolithic period (about 15 kya).
According to AMOVA results, 5.7% of observed diversity is due to differences between language
groups of Altaic family, 19.9% is due to differences between populations within language groups,
and only 74.3% of genetic diversity is attributable to within-population level.
In most populations werer found more than one lineage. Most ancient lineages (7-12 kya) were found
in Uzbek and Kirgiz Türkic-speaking populations of the Middle Asia. Among native Siberian populations most ancient Y
lineages was observed in Türkic ethnic groups in Altai and Tuva. The age of Siberian lineages
obtained from the microsatellite variance within the 'binary' haplogroup were 5 to 6 kya.
Mongol-speaking Buryats and Evenks, belonging to Tungus branch, have relatively 'young' lineages in
their male-specific gene pool. Age of two main Y-chromosome clusters in Buryats were 2,800 and 4,500 kya,
and the age of Evenk lineages were 2-3 kya. Using the molecular variance of microsatellite
haplotypes was estimated the age of ancestral haplotypes for 'binary' haplogroups. The age of
DYF155S2 deletion was estimated as about 6,9 kya, and the age of T-C transition at Tat locus as 4,2
kya.
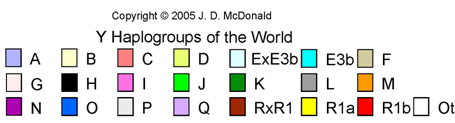
Color Codes (double check for accuracy)
Y-DNA Haplogroup frequency distribution in the gene pools of Türkic ethnic groups
and North-East Asian indigenous populations
| Population |
Y-DNA Haplogroup frequency, % |
| Haplogroups |
Others |
| Graph |
R1a |
R1b |
I |
E1b1b |
E1b1a |
H |
J |
G |
N |
O |
T |
L |
C |
D |
F |
K |
P |
Q |
| Türkic ethnic groups |
| Abdaly (Abzeli)/Ephtalites |
 |
19 |
55 |
0 |
0 |
0 |
0 |
8 |
1 |
8 |
- |
0 |
1 |
1 |
- |
- |
- |
- |
- |
0 |
| Askhuns (Nuristan) |
- |
R1a |
R1b |
I |
E1b1b |
E1b1a |
H |
J |
G |
N |
O |
T |
L |
C |
D |
F |
K |
P |
Q |
Others |
| Alats (Alayundu) |
 |
- |
- |
- |
15 |
- |
- |
32 |
- |
- |
- |
- |
- |
- |
- |
- |
- |
- |
- |
53 |
| Altaians (Northern) |
 |
38 |
6 |
0 |
0 |
- |
- |
2 |
0 |
10 |
- |
- |
- |
- |
- |
- |
- |
- |
- |
44 |
| Altaians (Altai kiji, Southern) |
 |
53 |
1 |
2 |
1 |
- |
- |
4 |
- |
12 |
- |
- |
- |
- |
- |
- |
- |
- |
- |
27 |
| Azeri - free |
 |
5 |
0 |
0 |
5 |
- |
- |
58 |
- |
0 |
- |
- |
- |
0 |
- |
- |
- |
- |
16 |
21 |
| Azeri - Iran |
 |
19 |
18 |
- |
11 |
- |
- |
27 |
8 |
2 |
- |
8 |
3 |
- |
- |
- |
- |
- |
5 |
0 |
| Balkars |
 |
13 |
5 |
3 |
3 |
- |
1 |
24 |
29 |
- |
- |
7 |
- |
- |
- |
- |
- |
- |
- |
11 |
| Bashkirs (Perm) |
 |
9 |
86 |
0 |
0 |
0 |
- |
0 |
2 |
2 |
- |
0 |
0 |
- |
- |
- |
- |
- |
- |
0 |
| Chuvash |
 |
32 |
4 |
11 |
- |
- |
- |
- |
- |
28 |
- |
- |
- |
2 |
- |
- |
- |
- |
0 |
24 |
| Bulgar (Türkic) |
|
R1a |
R1b |
I |
E1b1b |
E1b1a |
H |
J |
G |
N |
O |
T |
L |
C |
D |
F |
K |
P |
Q |
Others |
| Digors (N.Ossetia) |
 |
0 |
0 |
13 |
0 |
0 |
0 |
3 |
74 |
0 |
- |
0 |
0 |
0 |
- |
3 |
- |
6 |
0 |
1 |
| Dolgans |
 |
16 |
2 |
2 |
- |
- |
- |
- |
- |
34 |
- |
- |
- |
37 |
- |
- |
- |
- |
0 |
9 |
| Gagauzes Etulia |
 |
27 |
15 |
24 |
1 |
0 |
0 |
7 |
17 |
0 |
- |
0 |
0 |
0 |
- |
0 |
- |
0 |
0 |
0 |
| Gagauzes Komrat |
 |
- |
- |
- |
- |
- |
- |
- |
- |
- |
- |
- |
- |
- |
- |
- |
- |
- |
- |
- |
| Gagauzes Kongaz |
 |
13 |
10 |
31 |
17 |
- |
0 |
8 |
10 |
4 |
- |
6 |
- |
- |
- |
- |
- |
- |
- |
0 |
| Gilan |
 |
16 |
20 |
2 |
3 |
- |
2.0 |
36 |
16 |
2 |
- |
0 |
5 |
- |
- |
0 |
- |
- |
- |
7 |
| Gujarati (Abdaly/Ephtalite) |
|
R1a |
R1b |
I |
E1b1b |
E1b1a |
H |
J |
G |
N |
O |
8 |
L |
C |
D |
F |
K |
P |
Q |
Others |
| Kalasha |
Y_DNA_small.gif) |
18 |
- |
0 |
0 |
- |
- |
9 |
18 |
- |
- |
0 |
25 |
- |
- |
- |
- |
- |
- |
30 |
| Karachai |
 |
27 |
15 |
2 |
0 |
0 |
- |
10 |
32 |
0 |
- |
3 |
0 |
0 |
- |
0 |
- |
0 |
0 |
11 |
| Karakalpaks |
 |
18 |
9 |
- |
- |
- |
- |
9 |
- |
2 |
11 |
- |
5 |
- |
- |
9 |
7 |
- |
- |
22 |
| Kazakhs |
 |
- |
- |
- |
- |
- |
- |
- |
- |
- |
- |
- |
- |
- |
- |
- |
- |
- |
- |
- |
| Khakass (Yenisei Kyrgyz) |
 |
13 |
20 |
- |
4 |
- |
- |
46 |
12 |
- |
- |
2 |
- |
- |
- |
- |
- |
- |
- |
15 |
| Kumyks |
 |
14 |
21 |
- |
4 |
- |
- |
44 |
13 |
- |
- |
2 |
- |
- |
- |
- |
- |
- |
- |
2 |
| Kyrgyz (WP) |
 |
64 |
2 |
2 |
0 |
- |
- |
5 |
- |
2 |
- |
- |
0 |
- |
- |
- |
- |
- |
- |
25 |
| Lurs (Iran) |
 |
10 |
24 |
0 |
12 |
- |
- |
24 |
16 |
- |
- |
4 |
4 |
- |
- |
- |
- |
- |
5 |
2 |
| Mishars (Meshchera) |
 |
45 |
10 |
8 |
10 |
- |
- |
10 |
- |
16 |
- |
5 |
- |
- |
- |
- |
- |
- |
3 |
0 |
Pashtuns
N. Afghanistan |
 |
50 |
9 |
- |
- |
- |
- |
5 |
7 |
- |
- |
|
25 |
- |
- |
- |
- |
- |
3 |
4 |
Pashtuns
S. Afghanistan |
 |
67 |
10 |
- |
8 |
1 |
3 |
7 |
8 |
- |
- |
- |
6 |
2 |
- |
1 |
- |
1 |
2 |
0 |
| Rajput (Ephtalite) |
 |
31 |
- |
- |
- |
- |
- |
17 |
- |
- |
- |
- |
7 |
- |
- |
- |
- |
- |
- |
45 |
| Shorians |
 |
59 |
20 |
0 |
- |
- |
- |
0 |
- |
16 |
- |
- |
- |
2 |
- |
- |
0 |
2 |
2 |
2 |
| Soyotes |
 |
24 |
0 |
0 |
- |
- |
- |
0 |
- |
9 |
- |
- |
- |
18 |
- |
- |
27 |
0 |
0 |
18 |
| Tatars (WP) |
|
34 |
9 |
4 |
- |
- |
- |
- |
- |
23 |
- |
- |
- |
- |
- |
- |
- |
- |
- |
30 |
| Tatars (Kazan) |
 |
- |
- |
- |
- |
- |
- |
- |
- |
- |
- |
- |
- |
- |
- |
- |
- |
- |
- |
- |
| |
Graph |
R1a |
R1b |
I |
E1b1b |
E1b1a |
H |
J |
G |
N |
O |
T |
L |
C |
D |
F |
K |
P |
Q |
Others |
| Todjins |
 |
24 |
3 |
3 |
- |
- |
- |
- |
- |
11 |
- |
- |
- |
8 |
- |
- |
14 |
22 |
0 |
8 |
| Turkmens (Iran) |
 |
15 |
4 |
1 |
4 |
- |
- |
14 |
6 |
- |
- |
- |
5 |
- |
- |
- |
- |
- |
43 |
8 |
| Turkmens (WP) |
Y_DNA_small.gif) |
7 |
37 |
0 |
0 |
- |
- |
4 |
- |
10 |
- |
- |
0 |
- |
- |
- |
- |
- |
- |
43 |
| Turks (Turkey) |
 |
7 |
16 |
5 |
11 |
- |
- |
34 |
11 |
4 |
- |
3 |
4 |
- |
- |
- |
- |
- |
- |
6 |
| Turks (WP) |
 |
7 |
16 |
5 |
11 |
0 |
0 |
33 |
11 |
4 |
0 |
0 |
0 |
1 |
0 |
0 |
3 |
0 |
2 | 0 |
| Tuvinians |
 |
18 |
1 |
1 |
0 |
0 |
0 |
0 |
1 |
24 |
0 |
0 |
0 |
6 |
- |
4 |
9 |
35 |
- | 0 |
| Uigurs |
 |
25 |
18 |
0 |
0 |
0 |
0 |
11 |
5 |
0 |
- |
0 |
5 |
8 |
- |
0 |
7 |
0 |
5 |
16 |
| Uigurs (East Turkestan) |
 |
18 |
22 |
0 |
0 |
0 |
- |
10 |
4 |
6 |
- |
- |
4 |
- |
- |
- |
- |
- |
- |
35 |
| Uigurs (Urumchi) |
 |
19 |
23 |
- |
7 |
- |
- |
26 |
- |
10 |
- |
- |
0 |
- |
- |
- |
- |
- |
- |
16 |
| Uigurs (Yili river) |
 |
15 |
15 |
- |
0 |
- |
- |
- |
- |
8 |
- |
- |
- |
- |
- |
- |
- |
- |
- |
61 |
| Uzbeks |
 |
25 |
10 |
3 |
3 |
- |
- |
21 |
- |
- |
- |
- |
5 |
- |
- |
- |
- |
- |
- |
33 |
| Yiyrks (Iran, Mazandaran) |
 |
17 |
4 |
1 |
6 |
- |
5 |
40 |
21 |
0 |
- |
0 |
1 |
4 |
- |
0 |
- |
- |
0 |
0 |
|
Slavic populations (Slavic ethnic groups, Nordic)
(dominant Y-DNA Hg I) |
| - |
Graph |
R1a |
R1b |
I |
E1b1b |
E1b1a |
H |
J |
G |
N |
O |
T |
L |
C |
D |
F |
K |
P |
Q |
Others |
| Bosnians |
 |
25 |
1 |
42 |
10 |
- |
- |
- |
- |
- |
- |
- |
- |
- |
- |
- |
- |
- |
- |
22 |
| Czechs |
 |
32 |
32 |
18 |
6 |
- |
- |
5 |
5 |
2 |
- |
- |
- |
- |
- |
- |
- |
- |
- |
0 |
| Serbs (Bosnia) |
 |
14 |
6 |
41 |
22 |
0 |
- |
10 |
1 |
6 |
- |
0 |
0 |
- |
- |
- |
- |
- |
- |
0 |
| Slovenians |
 |
39 |
21 |
31 |
3 |
- |
- |
4 |
3 |
- |
- |
- |
- |
- |
- |
- |
- |
- |
- |
0 |
| Slovaks |
 |
27 |
36 |
18 |
2 |
- |
- |
5 |
5 |
2 |
- |
- |
- |
- |
- |
- |
- |
- |
- |
5 |
| Ukrainians |
 |
48 |
10 |
22 |
6 |
- |
- |
8 |
2 |
6 |
- |
1 |
- |
- |
- |
- |
- |
- |
- |
0 |
|
North-West Asian populations (Uralic/Ugro-Finn ethnic groups) |
| |
Graph |
R1a |
R1b |
I |
E1b1b |
E1b1a |
H |
J |
G |
N |
O |
T |
L |
C |
D |
F |
K |
P |
Q |
Others |
| Hungarians |
 |
24 |
20 |
25 |
8 |
- |
- |
8 |
8 |
4 |
- |
1 |
1 |
1 |
- |
- |
- |
- |
3 |
- |
|
North Asian populations (Fennic-Uralic-Nenets ethnic group)
(dominant Y-DNA Hg N) |
| Chukchis |
 |
4 |
0 |
0 |
- |
- |
- |
- |
- |
58 |
- |
- |
- |
4 |
- |
- |
- |
21 |
16 |
0 |
| Finns |
 |
31 |
2 |
2 |
- |
- |
- |
- |
- |
63 |
- |
- |
- |
- |
- |
- |
- |
- |
- |
22 |
| Estonians |
 |
37 |
9 |
19 |
3 |
- |
- |
1 |
- |
41 |
- |
- |
- |
- |
- |
- |
- |
- |
- |
- |
| Nenets |
 |
41 |
- |
- |
- |
- |
- |
- |
- |
58 |
- |
- |
- |
0 |
- |
- |
- |
- |
0 |
1 |
| Nganasans |
 |
- |
- |
- |
- |
- |
- |
- |
- |
92 |
- |
- |
- |
5 |
- |
- |
- |
- |
- |
3 |
| Komi |
 |
33 |
16 |
5 |
- |
- |
- |
- |
- |
35 |
- |
- |
- |
0 |
- |
- |
- |
- |
0 |
11 |
| Komi-Permyaks |
|
R1a |
R1b |
I |
E1b1b |
E1b1a |
H |
J |
G |
N |
O |
T |
L |
C |
D |
F |
K |
P |
Q |
Others |
| Komi-Zyryans |
 |
33 |
16 |
5 |
- |
- |
- |
- |
- |
35 |
- |
- |
- |
0 |
- |
- |
- |
- |
0 |
11 |
| Mordvins (Burtases) |
 |
27 |
13 |
20 |
- |
- |
- |
- |
- |
19 |
- |
- |
- |
0 |
- |
- |
- |
- |
0 |
22 |
| Mari |
 |
48 |
3 |
8 |
- |
- |
- |
- |
- |
42 |
- |
- |
- |
0 |
- |
- |
- |
- |
0 |
1 |
| Moksha |
 |
27 |
13 |
19 |
- |
- |
- |
- |
- |
19 |
- |
- |
- |
- |
- |
- |
- |
- |
- |
19 |
| Sakha (Yakuts) (Turkic) |
 |
2 |
2 |
1 |
- |
- |
- |
- |
- |
88 |
- |
- |
- |
3 |
- |
- |
- |
- |
0 |
3 |
| Tofalars (Turkic) |
 |
13 |
13 |
3 |
- |
- |
- |
- |
- |
59 |
- |
- |
- |
6 |
- |
- |
3 |
3 |
- | 0 |
| Yupik (Eskimo) |
 |
0 |
- |
- |
- |
- |
- |
- |
- |
51 |
0 |
- |
- |
0 |
- |
- |
- |
18 |
21 |
0 |
| Udmurts |
 |
10 |
2 |
1 |
- |
- |
- |
- |
- |
85 |
- |
- |
- |
0 |
- |
- |
- |
- |
0 |
1 |
North-East Asian populations
Chukotko-Kamchatkan language family Chukcha, Eskimo |
| |
Graph |
R1a |
R1b |
I |
E1b1b |
E1b1a |
H |
J |
G |
N |
O |
T |
L |
C |
D |
F |
K |
P |
Q |
Others |
| Itelmen (Kamchatka |
 |
22 |
- |
- |
- |
- |
- |
- |
- |
11 |
- |
- |
- |
67 |
|
- |
- |
- |
- |
0 |
| Kets |
 |
0 |
0 |
0 |
- |
- |
- |
- |
- |
0 |
- |
- |
- |
6 |
- |
- |
- |
- |
94 |
0 |
| Tungus (Ch. Dunhu), Mongols
(Austronesian, dominant Y-DNA Hg C) |
| |
Graph |
R1a |
R1b |
I |
E1b1b |
E1b1a |
H |
J |
G |
N |
O |
T |
L |
C |
D |
F |
K |
P |
Q |
Others |
| Buryats |
 |
2 |
1 |
1 |
- |
- |
0 |
1 |
20 |
- |
| - |
- |
64 |
- |
- |
- |
2 |
2 | 0 |
| Evenks |
 |
1 |
- |
5 |
- |
- |
- |
- |
- |
20 |
- |
- |
- |
68 |
- |
- |
- |
- |
4 |
2 |
| Evens |
|
7 |
- |
3 |
- |
- |
- |
- |
- |
13 |
- |
- |
- |
74 |
- |
- |
- |
- |
- |
3 |
| Hazara (Pakistan) |
 |
61 |
- |
- |
- |
- |
- |
- |
- |
- |
- |
- |
- |
30 |
- |
- |
- |
- |
- |
9 |
| Kalmyks (WP) |
 |
6 |
3 |
- |
- |
- |
- |
0 |
- |
3 |
- |
- |
2 |
71 |
- |
- |
4 |
12 |
- |
0 |
| Koryaks |
 |
- |
- |
- |
- |
- |
- |
- |
- |
22 |
- |
- |
- |
59 |
- |
- |
- |
19 |
- |
- |
| Mongols (WP) |
 |
9 |
- |
- |
- |
- |
- |
3 |
1 |
11 |
13 |
0 |
0 |
54 |
- |
- |
2 |
5 |
- |
6 |
| Japanese, Koreans, Manchu
(dominant Y-DNA Hg O) |
| |
Graph |
R1a |
R1b |
I |
E1b1b |
E1b1a |
H |
J |
G |
N |
O |
T |
L |
C |
D |
F |
K |
P |
Q |
Others |
| Japanese |
 |
0 |
0 |
- |
- |
- |
- |
- |
- |
4 |
52 |
- |
- |
9 |
35 |
- |
- |
- |
1 |
34 |
| Koreans |
 |
2 |
- |
- |
- |
- |
- |
- |
2 |
- |
70 |
- |
- |
16 |
2 |
- |
2 |
- |
- |
6 |
| Kian (Qiang) |
Y_DNA_small.gif) |
6 |
- |
- |
- |
- |
- |
- |
- |
- |
67 |
- |
- |
9 |
18 |
- |
- |
- |
- |
0 |
| Manchu |
 |
- |
- |
- |
- |
- |
- |
- |
- |
14 |
54 |
- |
- |
26 |
3 |
- |
3 |
- |
- |
0 |
|
|
Y-DNA HAPLOGROUP DEFINITIONS
|
|
Family Tree DNA
and similar sites
provide thumbnail summaries of the different haplogroups :
- Haplogroup B is one of the oldest Y-chromosome lineages in humans.
Haplogroup B is found exclusively in Africa, it is the only African haplogroup among the Eurasian
haplogroup branch of B through T, leading to a suggestion that it returned to Africa after its
emergence in Eurasia. This lineage was the first to
disperse around Africa. Haplogroup B appears at low frequency all around Africa, its
highest frequency in Pygmy populations.
- Haplogroup C is found throughout mainland Asia, the south Pacific,
and at low frequency in Native American populations. Haplogroup C originated in
southern Asia and spread in all directions. This lineage colonized New Guinea,
Australia, and north Asia, and currently is found with its highest diversity in
populations of India. In Eurasia, it is a leading haplogroup of the Tungus people, with spillovers
to the Tungus neighbors, present Mongols.
- Haplogroup C3 is believed to have originated in southeast or central
Asia. This lineage then spread into northern Asia, and then into the Americas.
- Haplogroup D2 most likely derived from the D lineage in Japan. It is
completely restricted to Japan, and is a very diverse lineage within the
aboriginal Japanese and in the Japanese population around Okinawa.
- Haplogroup E3a is an Africa lineage. It is currently hypothesized
that this haplogroup dispersed south from northern Africa within the last 3,000
years, by the Bantu agricultural expansion. E3a is also the most common lineage
among African Americans.
- Haplogroup E3b is believed to have evolved in the Middle East. It
expanded into the Mediterranean during the Pleistocene Neolithic expansion. It
is currently distributed around the Mediterranean, southern Europe, and in north
and east Africa. Haplogroup E3b is connected with maritime spread in Europe and Semitic languages.
- Haplogroup G may have originated in India or Pakistan, and has
dispersed into central Asia, Europe, and the Middle East. The G2 branch of this
lineage (containing the P15 mutation) is found most often in Europe and the
Middle East.
- Haplogroup H is nearly completely restricted to India, Sri Lanka, and
Pakistan. It was decimated in Europe during 4th-3rd mill. BC population replacement by A1b Kurgan
people. European Haplogroup H people were settled farmers.
- Haplogroups I, I1, and I1a are nearly completely restricted to
northwestern Europe (Nordics). These would most likely have been common within Viking
populations. One lineage of this group extends down into central Europe. Haplogroups I and N form the base
of the Slavic populations.
- Haplogroup I1b was derived within Scandinavian Paleolithic populations in
northwest Europe and has since spread down into southern Europe where it is
present at low frequencies.
- Haplogroup J is found at highest frequencies in Middle Eastern and
north African populations where it most likely evolved. This marker has been
carried by Middle Eastern traders into Europe, central Asia, India, and Pakistan. Spread of farming
to Europe is attributed to spread of Haplogroup J.
- Haplogroup J2 originated in the northern portion of the Fertile Crescent where it later
spread throughout central Asia, the Mediterranean, and south into India. As with other populations
with Mediterranean ancestry this lineage is found within Jewish populations. The Cohen modal lineage
is found in Haplogroup J2, somewhat recent line.
- Haplogroup N originated in Siberia, Mongolia, or China approximately 15,000 to 20,000
years ago from the haplogroup NO (50 KYA) of the most productive NOP branch (55 KYA). It was spread
across northern Eurasia by large-scale Finno-Ugric human migrations, also called Uralic. Haplogroup
N is typical for Baltics 45%, Finns 60%, Nenets 75%, Prussians 28%, Saami 40%, Yakuts 75%. Haplogroups I and N form the base
of the Slavic populations.
- Haplogroup O is the dominant lineage of East Asians, comprising more than a quarter of
all males on the world. Among Austronesian-speaking and Han Chinese populations frequency hovers around 55%.
- Haplogroup Q is the lineage that links Asia and the Americas. This
lineage is found in North and Central Asian populations as well as native
Americans. This lineage is believed to have originated in Central Asia and
migrated through the Altai/Baikal region of northern Eurasia into the Americas.
- Haplogroup Q3 is the only lineage strictly associated with native
American populations. This haplogroup is defined by the presence of the M3
mutation (also known as SY103). This mutation occurred on the Q lineage 8-12
thousand years ago as the migration into the Americas was underway. There is
some debate as to on which side of the Bering Strait this mutation occurred, but
it definitely happened in the ancestors of the Native American peoples.
- Haplogroup R1a is believed to have originated in the Eurasian Steppes
south of Siberia 20kya. These people were believed to be the first
speakers of the Indo-European language group, formed in 4th-3rd mill. BC the N.Pontic refuge by the
refugees from the Kurgan carnage. This lineage is currently found in
central and western Asia, India, among Türkic populations, and in Slavic populations of Eastern Europe.
- Haplogroup R1b is believed to have originated in the Eurasian Steppes
south of Siberia 16kya. From this lineage originated
population of the Kurgan culture, known for the domestication of the horse
(approximately 6000 BC), it expanded east and west from the Pontic steppes, reached Western Europe
via overland Kurgan waves and via circum-Mediterranean route, decimated farming populace of Europe
in 4th-3rd mill. BC, and became the most common haplogroup in European populations.
This lineage is the haplogroup containing the Atlantic modal haplotype (HG1). The Haplogroup R1b is identified with
non-IE languages of Eurasia and pre-1000 BC Europe, and is identified with populations of the Türkic linguistic family.
- Haplogroup T remains a promising puzzle, it is genetically close to R/R1a/R1b, it evolved
about 13 kya, and may be a valuable tracing tool.
|
|


Y_DNA.gif)


Y_DNA.gif)


Y_DNA.gif)